To create the report to illustrate the WEP strategy, you first need to enter the product features based on the following:
- The
policyowner must be an individual
-
Premium frequency set to Annual
-
Do not add any additional coverage, since it's not considered when comparing amounts in the report.
This applies to the presentation and is not a constraint for selling additional coverage.
How to create the illustration and the strategy report
- Click the
Strategies tab.
- Open the
Concepts section.
- In the
Affluent client’s section, select
Wealth Escalator Plan.
- Click the
Export button to download the illustration data to an Excel spreadsheet.
Open the downloaded file through your browser or in your
Downloads folder.
You'll have 60 minutes to open the file and access the data in the illustration. After that, you'll have to download the spreadsheet again. - Enable content and macros when opening the spreadsheet.

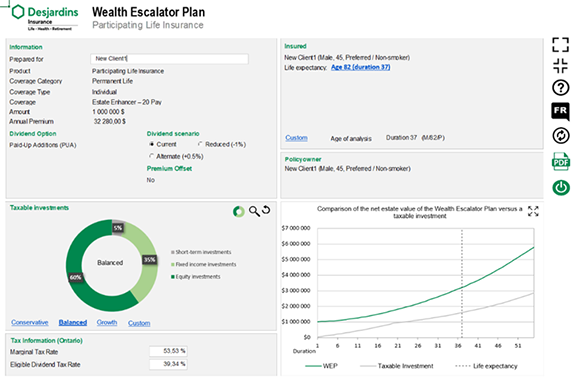
- This screen will appear for the selected product:

- Make sure the information about the proposed insured and the insurance coverage is correct. If it isn't, exit the page and restart the illustration.
- Confirm or change the name of the client the strategy is being prepared for.
- In the
Insureds section, select the period of time you want to analyze.
Click the
Personalize link to select the life expectancy of one of the proposed insureds, the equivalent age or any other period.
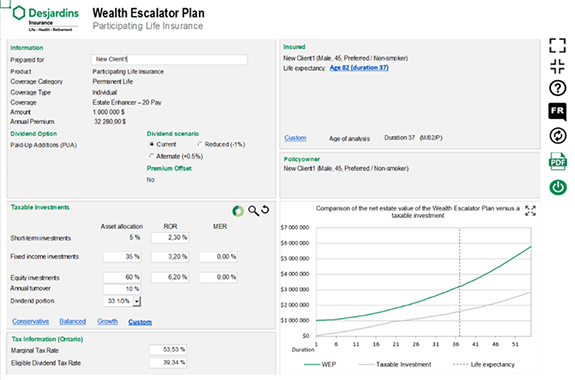
The time selected is indicated on the charts by a dotted vertical line. - Create a hypothetical portfolio in the Taxable Investment section, either by choosing the default values related to the chosen investor profiles, or by allocating the composition yourself between short-term investments, fixed-income investments, and equity investments.
The allocation must always total 100%.
For each type of investment, determine a realistic rate of return based on the current environment. This investment portfolio will be compared with the values in the insurance contract. We assume that the sums invested in the 2 scenarios are the same. The composition of the investment can be visualized in graphical or tabular form, according to your preference.

- The tax rates shown are in the calculations
vary by province or territory. These rates are updated and do not need to be changed.
- An interactive chart will show how the results change based on the data you enter.
The chart shows the net value that will go to the estate for the insurance with the WEP strategy and the investment.
This chart illustrates the results up to age 100 of the proposed insured. The results can help them make an informed decision. You can save the report and give them the option they choose. - Click the
Display report button and it will open as a PDF.
- A copy of the report is automatically saved in the
/Downloads/Desjardins.
You can also save it manually. - Go back to the
Wealth Escalator Plan input screen and click
Exit.
You can only use the saved PDF copy of the report.
To present the strategy again, you'll need to create a new illustration and download it from the
Strategies tab.
